Cisco Expected to Report Lower Q4 Results
This Oversold Stock Market Rally Could Signal a Buying Opportunity

How the Stock Market Is Going to Develop
The S&P 500 has experienced a swift recovery since hitting lows on August 5, raising questions among investors: Is this merely an oversold rally, or the start of a new leg upward in a continuing bull market? Understanding the signals and indicators at play can help in making informed investment decisions.
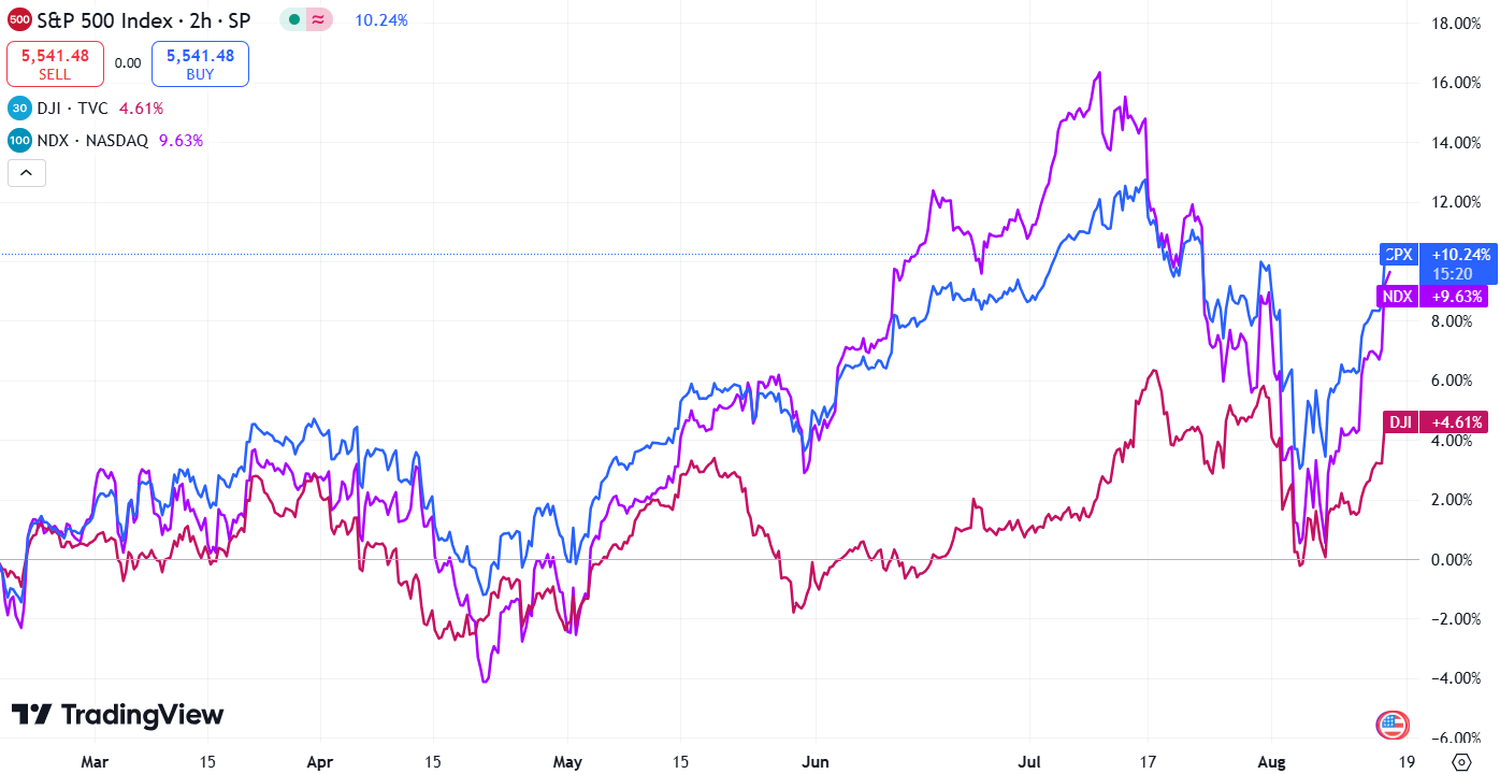
Is This an Oversold Rally or the Start of a Bullish Trend?
Historically, oversold rallies tend to peak around the market's declining 20-day moving average (MA), often exceeding it slightly before the market slips again. The current rally surpassed its 20-day MA on August 13, closing a gap on the SPX chart at 5,410. A downtrend line, marking lower highs, is currently positioned just below 5,500. If this rally is simply a reaction to oversold conditions, its upward momentum may be nearing its limit. However, if the SPX breaks through this downtrend line and exceeds the August 1 peak of 5,570, it could indicate that the recent decline was merely a correction within an ongoing bull market.
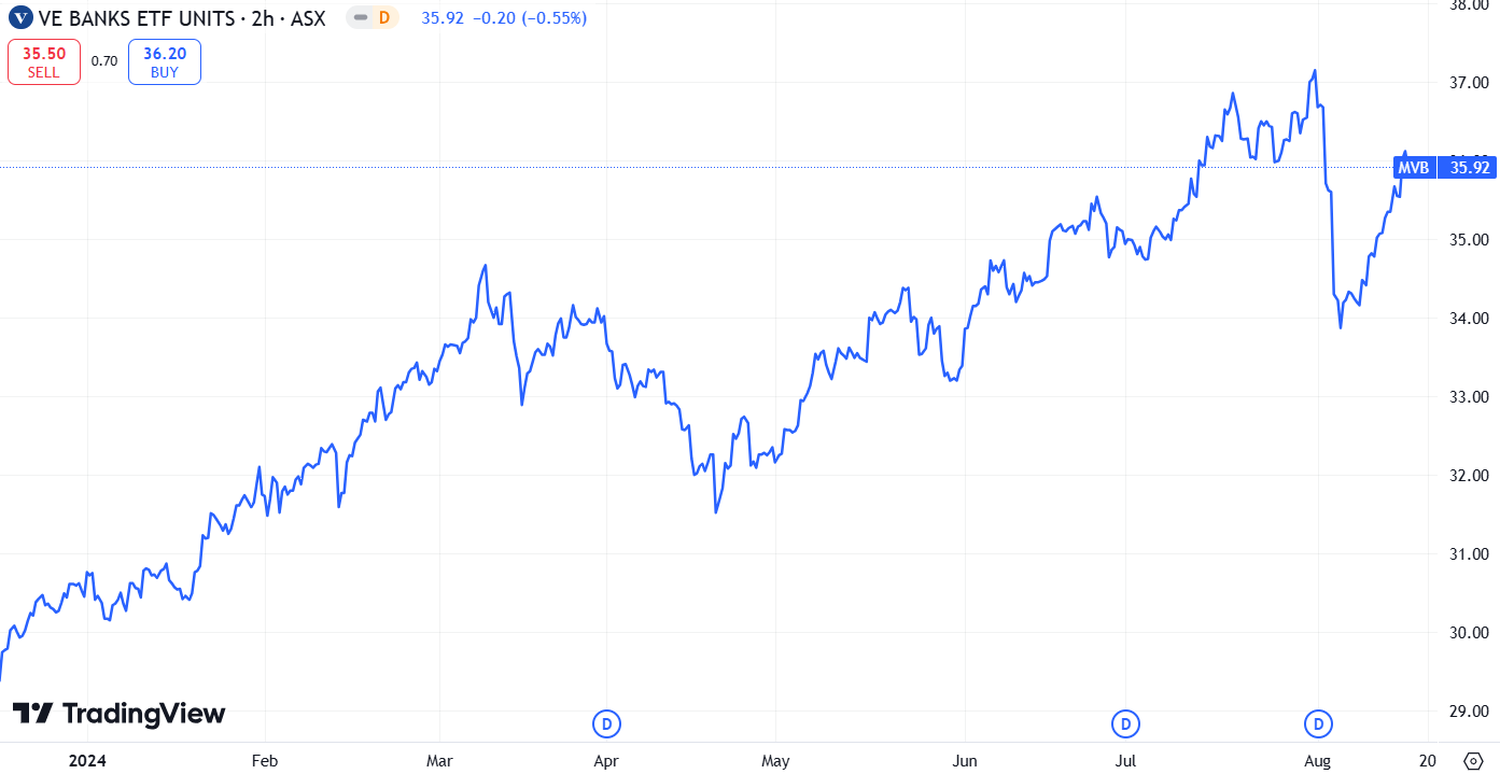
McMillan Volatility Band and Put-Call Ratios
The McMillan Volatility Band (MVB) buy signal from August 9 remains in effect, targeting the +4σ Band, which is slightly above 5,700 and declining. However, all "modified Bollinger Bands" (mBB) and shorter-term moving averages are descending. The MVB buy signal would be invalidated if the SPX closes below the -4σ Band, currently at 5,100 and declining. Despite the ongoing rally, equity-only put-call ratios continue to signal a bearish outlook, as they have been rising during this period. Market breadth remains mixed, with the NYSE showing stronger performance compared to the "stocks only" breadth since late July. Both breadth oscillators are currently on buy signals, with the NYSE oscillator nearing overbought territory.
New Highs vs. New Lows and Volatility Indicators
A significant positive development is the number of new highs on the NYSE, which exceeded 100 on August 14. If this trend continues, it could generate a new buy signal. Realized volatility, measured as the 20-day historical volatility of SPX (HV20), remains elevated at 22%, a bearish signal that began when HV20 crossed above 10%. However, if HV20 drops back to 15%, the bearish threat could diminish.
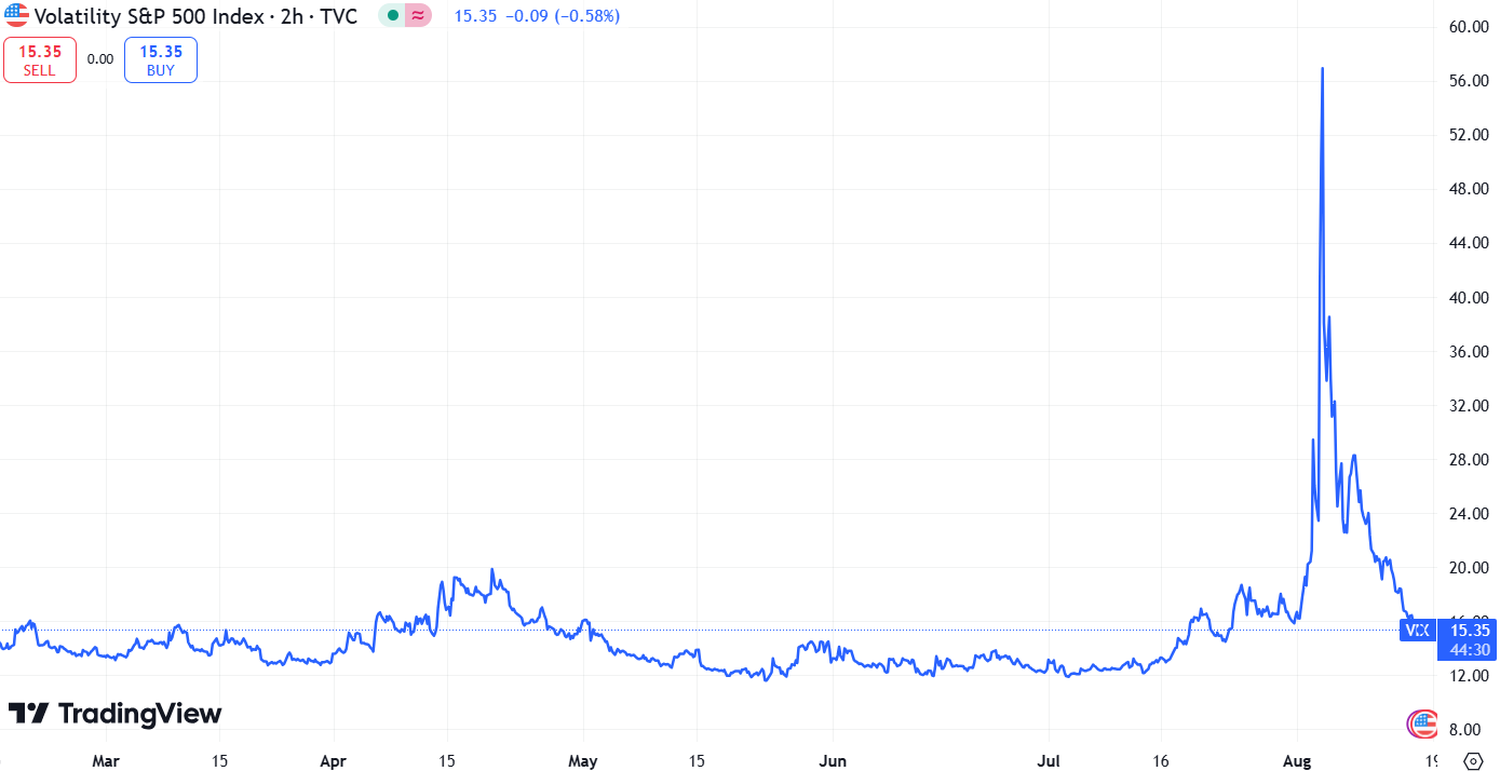
Implied volatility, represented by the VIX, is offering mixed signals. The spike peak buy signal from August 5 is still valid, but a trend of VIX sell signals is also in effect. The latter would be nullified if the VIX closes below its 200-day MA, currently at 14.50. The VIX has been trending lower, now around 15.60, suggesting that the sell signal could be short-lived. However, the structure of volatility derivatives, particularly VIX futures, remains bearish, with the front-month August VIX futures trading at higher prices than September futures. This downward slope in the term structure has historically been a negative sign for the stock market.
New Trading Recommendations
Given the current market conditions, several new trading opportunities have emerged:
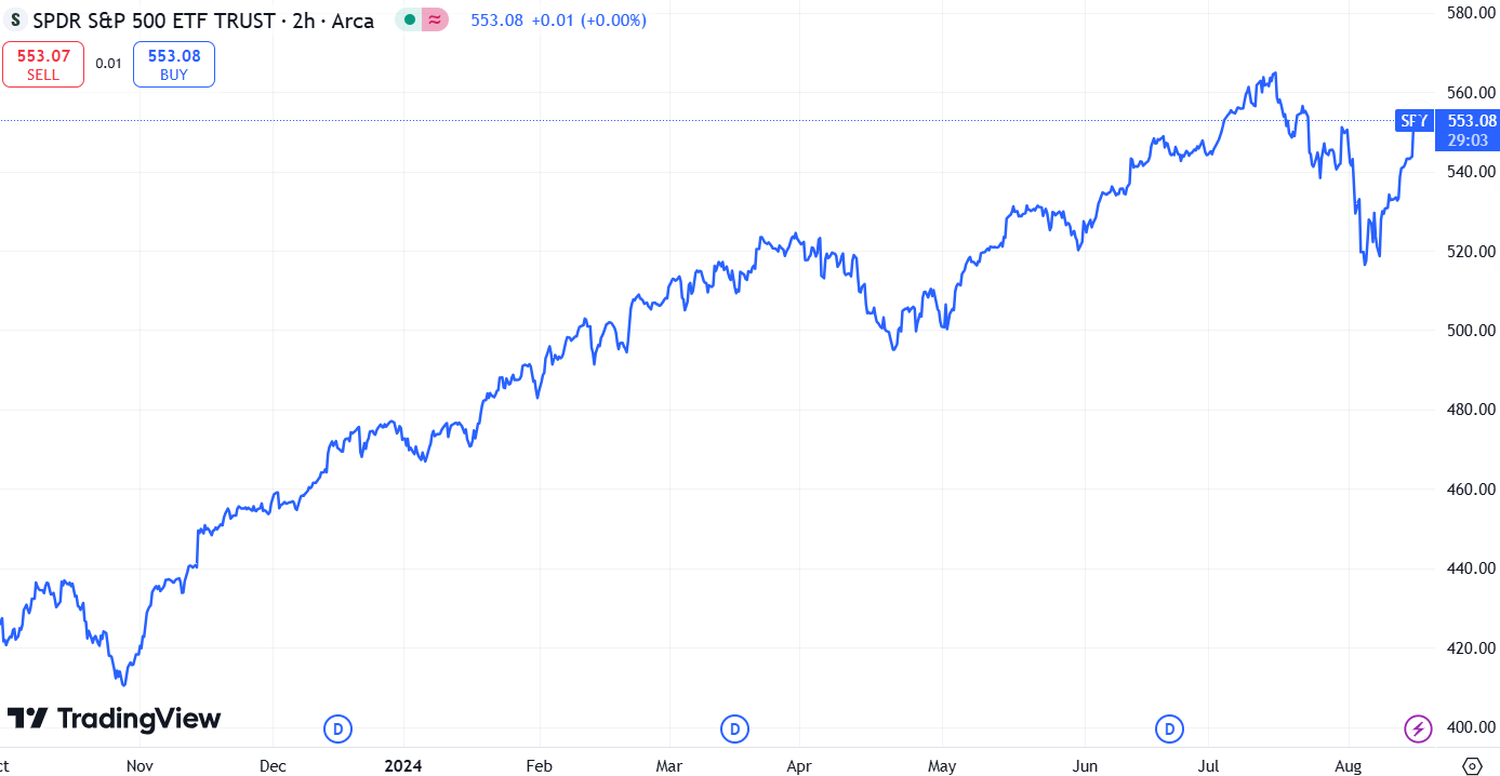
S&P 500 (SPY): If the number of new highs on the NYSE surpasses 100 on August 15, buy 1 SPY (October 18) at-the-money call and sell 1 SPY (October 18) call with a strike price 20 points higher. This spread should be stopped out if, at a later date, NYSE new lows exceed new highs for two consecutive days.
Chipotle Mexican Grill (CMG): A new weighted put-call ratio buy signal has been issued for CMG following a sharp decline after its CEO announced his departure. If CMG closes above $52.30, buy 3 CMG (September 27) 52 calls.
Walgreens Boots Alliance (WBA): WBA could be a longer-term buy opportunity. If WBA closes above $13.10, buy 2 WBA (August 30) 13 calls.
Follow-Up Actions
All trades come with mental closing stops unless otherwise specified. Standard rolling procedures apply to SPY spreads, where the spread is rolled if the underlying hits the short strike.
Conclusion:
This rally presents a potential buying opportunity, but caution is advised given the mixed signals from various market indicators. If key resistance levels are broken, it could signal the continuation of a bull market. However, if the rally falters, it may confirm the oversold nature of the recent bounce. Investors should carefully monitor market breadth, volatility, and the performance of key indicators like the VIX and McMillan Volatility Bands to navigate this uncertain environment effectively.