Analysts See Further Upside Potential
Costco Stock at 52-Week High: Is It A Good Time to Buy?
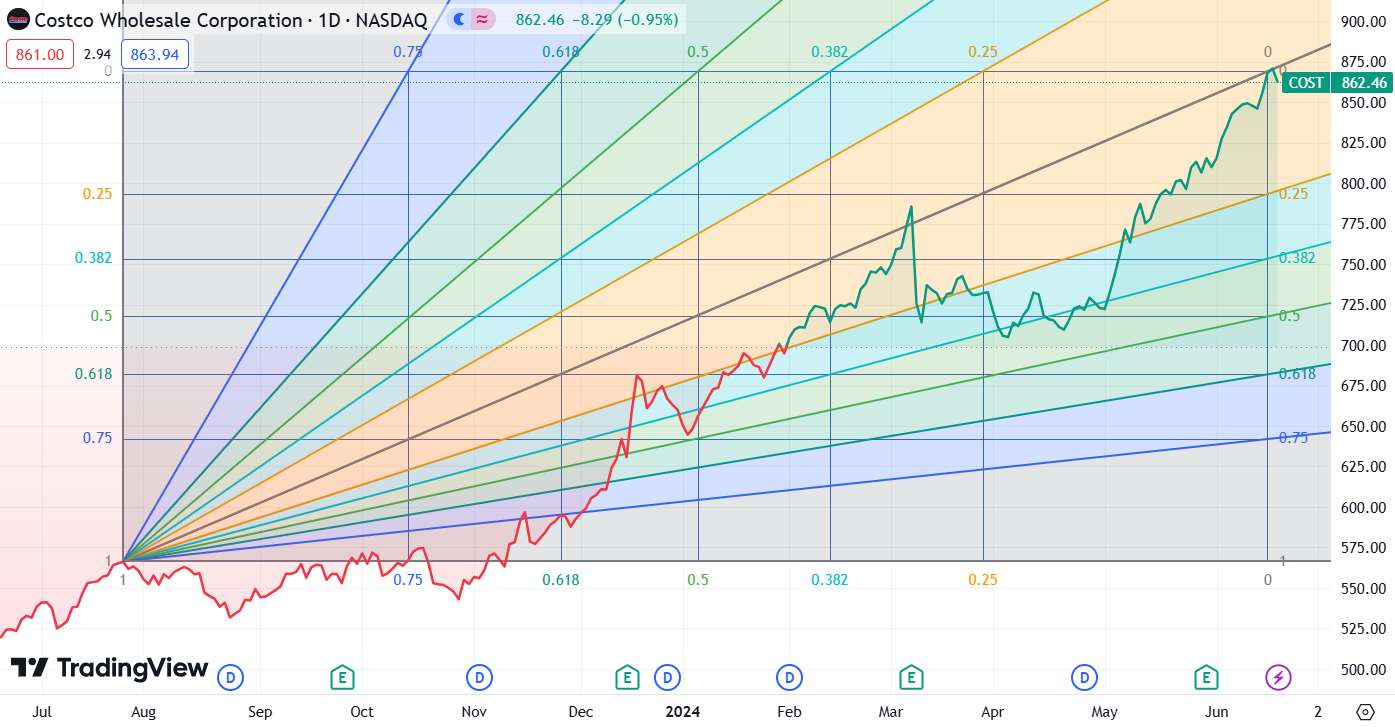
Technical Indicators Suggest a Bullish Trend
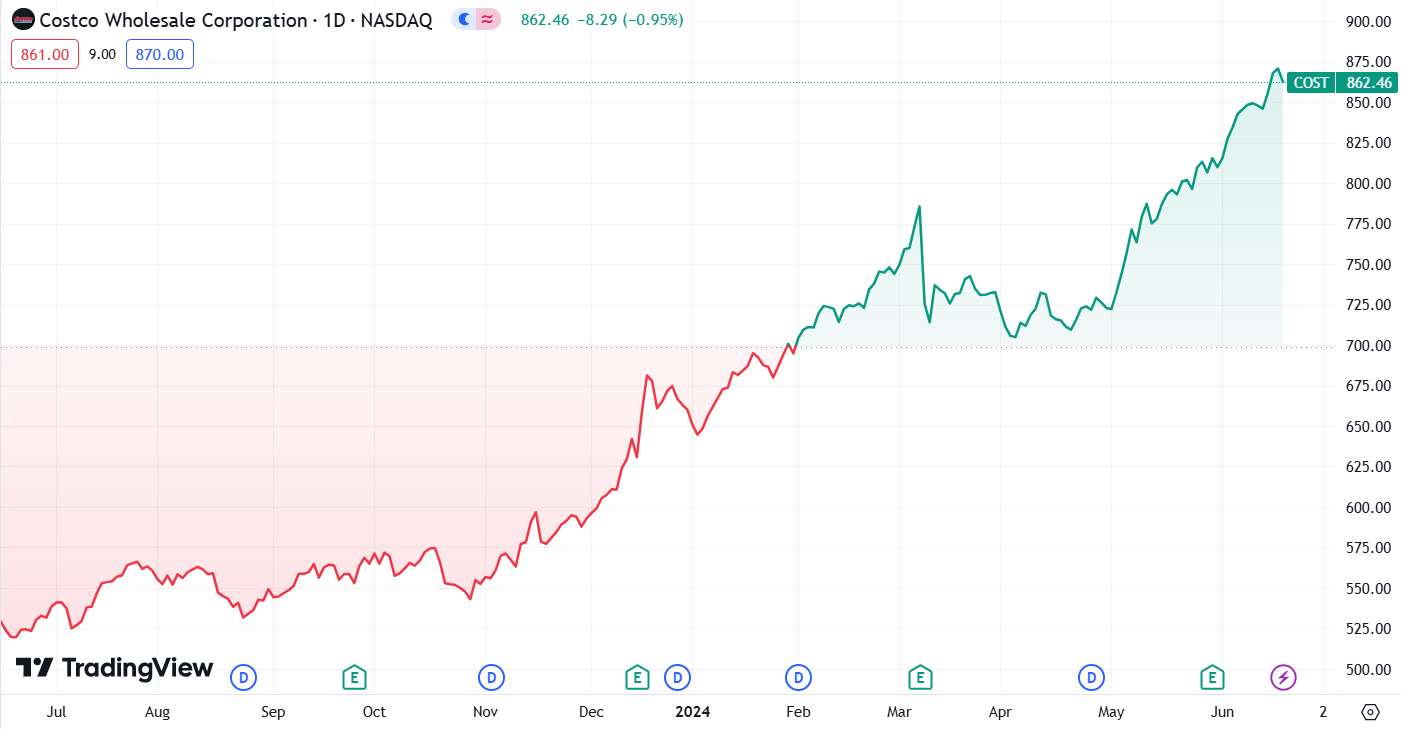
Costco Wholesale Corp (NASDAQ)
Has been on a remarkable upward trajectory, gaining 71.22% over the past year and 31.81% year-to-date. As of Thursday morning, the stock was trading around $870 per share, peaking at a new high of $873.96 during intraday trading on June 18.
This impressive performance has attracted the attention of investors and analysts, prompting a detailed analysis of the stock's technical indicators to evaluate if it remains a promising investment opportunity.
Technical Indicators Suggest a Bullish Trend
Current Price and Moving Averages:
Costco's stock is currently trading above its key exponential moving averages (EMAs) – the 5-, 20-, and 50-day EMAs – signaling a robust bullish trend. Specifically, the stock's price is $862.80, while the 8-day simple moving average (SMA) stands at $856.07, indicating a bullish signal. Furthermore, the 20-day SMA is $833.33, and the 50-day SMA is $781.29, both reinforcing the positive trend.
Long-term Outlook:
The long-term trend is equally positive, with Costco's 200-day SMA at $677.70, significantly below its current trading price. This discrepancy further supports the stock's bullish outlook.
Momentum Indicators:
The Moving Average Convergence Divergence (MACD) indicator, at 23.58, suggests strong bullish momentum. However, the Relative Strength Index (RSI) of 74.87 indicates that the stock is overbought, which could imply potential short-term price corrections.
Bollinger Bands:
Costco's Bollinger Bands (20) range between $787.86 and $878.85. This indicates that Costco is trading well above its recent average prices, demonstrating strong demand and bullish signals.
Analysts See Further Upside Potential
Recent analyst ratings from Evercore ISI Group, Loop Capital, and Oppenheimer, released from June 6 onwards, have an average price target of $911.67 for Costco's stock. This implies a 4.88% upside from the current price, underscoring market confidence in Costco's continued growth.
Conclusion
Costco's stock has reached a 52-week high, driven by strong technical indicators and positive analyst ratings. Despite the RSI suggesting that the stock is overbought, the overall trend remains bullish. For investors considering entering or increasing their position in Costco, the current technical analysis supports a bullish outlook with potential for further gains. However, it's essential to remain vigilant for any short-term corrections due to the overbought conditions.
Key Takeaways:
- Current Price: $862.80
- 8-Day SMA: $856.07
- 20-Day SMA: $833.33
- 50-Day SMA: $781.29
- 200-Day SMA: $677.70
- MACD: 23.58
- RSI: 74.87
- Bollinger Bands (20): $787.86 - $878.85
- Average Analyst Price Target: $911.67 (4.88% upside)
While the technical indicators and analyst ratings suggest a continued bullish trend, the high RSI indicates potential for short-term corrections. Investors should weigh the strong long-term outlook against the possibility of near-term volatility.